Roofray solar calculator vs pvwatts

Steppapajon
Registered Users Posts: 11 ✭
Hello Everyone,
I have used
http://www.roofray.com/calculator
and now thanks to this forum I have found
http://www.nrel.gov/rredc/pvwatts/
Both are nice tools and seem to closely agree with one another.
Running info on a 4KW system with array tilt (29 degrees) and array azimuth (180 degree) I get the following results
PVWATTS = 5165 KWH annually
RoofRay = 5418 KWH annually
So they are pretty close.
The nice thing about RoofRay is it lets you use satellite images of your property to simulate the array.
My question is this. Has anyone with an array of known output used these simulators to compare to real world numbers?
If so what were the results?
Thanks,
Jonathan
Comments
-
Re: Roofray solar calculator vs pvwatts
I have. For a presentation to a green energy group here in Austin I researched a system mounted on a parking structure at a public library. It had been on a monitoring system for a while, so I had two years of data to compare with PVWatts. Using the default .77 derate, the actual system output natched the PVWatts projection to within a couple percent.Steppapajon wrote: »Hello Everyone,
I have used
http://www.roofray.com/calculator
and now thanks to this forum I have found
http://www.nrel.gov/rredc/pvwatts/
Both are nice tools and seem to closely agree with one another.
Running info on a 4KW system with array tilt (29 degrees) and array azimuth (180 degree) I get the following results
PVWATTS = 5165 KWH annually
RoofRay = 5418 KWH annually
So they are pretty close.
The nice thing about RoofRay is it lets you use satellite images of your property to simulate the array.
My question is this. Has anyone with an array of known output used these simulators to compare to real world numbers?
If so what were the results?
Thanks,
Jonathan -
Re: Roofray solar calculator vs pvwatts
Agreed compared to my system over a couple years the derate on PVwatts of 0.77 is conservative, mine is more like 0.80. -
Re: Roofray solar calculator vs pvwattsSteppapajon wrote: »Hello Everyone,
... My question is this. Has anyone with an array of known output used these simulators to compare to real world numbers?
If so what were the results?
I do on a daily basis. My 8.1 KW system's output ranges from 89 - 41% efficient. Summarized for 13 months it looks like this:
Best regards,
Bill -
Re: Roofray solar calculator vs pvwattsI do on a daily basis. My 8.1 KW system's output ranges from 89 - 41% efficient. Summarized for 13 months it looks like this:
Best regards,
Bill
For apples to apples, can you plot the average of the real data? Eyeballing your chart it looks to me like it would fall pretty much halfway between the two projections. -
Re: Roofray solar calculator vs pvwattsFor apples to apples, can you plot the average of the real data? Eyeballing your chart it looks to me like it would fall pretty much halfway between the two projections.
The efficiency is 71% looking at the last 365 days (rolling 12 month avg basis). Starting in June the efficiency started rising due to 2 factors: (1) a tree that partially shaded the array died, and has been partially removed; and (2) we had a particularly cloudless (rain free) Summer here in Dallas.
The result is as expected, noting that 3 of 4 strings are at 210° and the 4th is at 285° vs all at 180° azimuth. And all strings are connected to a common (MPPT) inverter (SMA Sunny Boy) vs an inverter per azimuth orientation. There's also partial shade on one string in the morning due to a chimney and partial shade on another string in the afternoon due to tree shading. (Panels are all at 35° tilt.)
(The reference line WRT the utility is because they heavily subsidized the installation (at $2.40/W). In return, they expect minimum production to be at least 80% of PVWatts' estimated production at default 77%. Thus the blue line is 80% * 77% = 62%. At an actual 71% efficient on an annual basis at the moment, this system complies with the utility company's minimum expectation.)
Here's the chart: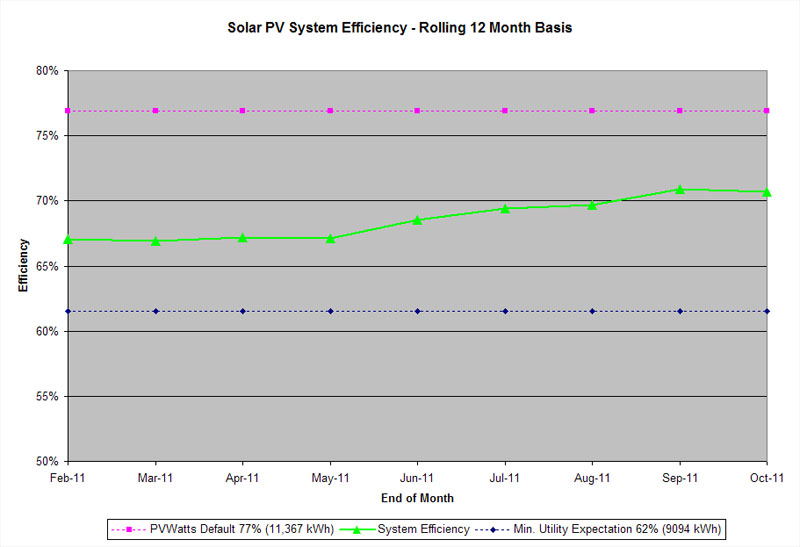
Best regards,
Bill -
Re: Roofray solar calculator vs pvwatts
Thanks for the replies Everyone.
It is always nice to have several sources of real world information to confirm or deny a simulator. It sounds like PVWatts has done a pretty good job on theirs.
Jonathan -
Re: Roofray solar calculator vs pvwattsSteppapajon wrote: »Thanks for the replies Everyone.
... It sounds like PVWatts has done a pretty good job on theirs.
PVWatts' insolation numbers take into account weather conditions other than temperature. The insolation numbers are stated at the STC temperature.
PVWatts' monthly production numbers take into account weather and temperature.
Both sets of numbers are for a specific location, and for some long period of time to average over (20 years?).
Best regards,
Bill -
Re: Roofray solar calculator vs pvwatts
I am currently monitoring three solar PV systems in Salida Colorado, and all are putting out significantly more (~20+%) than predicted by PVWatts as shown in Figs. 6 and 7 of link below. I have also included a literature survey of some other comparisons of PVWatts versus field measurements at:
http://www.residentialenergylaboratory.com/comparison_of_pv_systems.html -
Re: Roofray solar calculator vs pvwatts
Do you still have the presentation materials for the parking structure?
I understand that parking structures can be pretty difficult to anchor panels too.
Did you use ballast pans or anchors?
I'm an environmentalist and am trying to get solar installed on a parking structure out here in
the SF Bay Area. Your assistance will be greatly appreciated.
Sincerely,
Steve Kennedy
(650) 274-2709
canonbal@earthlink.net -
Re: Roofray solar calculator vs pvwatts
It seems as though Roofrays has gone the way of the dinosaur. I was able to find In My Back Yard @ http://maps.nrel.gov/imby that is similar. It also allows you to enter your address (at least in the US) and then define your array onto your home or other structure. It will let you simulate very small arrays. I did a 60 watt panel and it ran fine. Much better than PV watts minimum. I hope this helps someone. -
Re: Roofray solar calculator vs pvwatts
Thank you SPJ,
I have added it to the working FAQ post.
-BillNear San Francisco California: 3.5kWatt Grid Tied Solar power system+small backup genset -
Re: Roofray solar calculator vs pvwatts
stepapajon
I can't believe the different values that are given for different years on the site you posted. There is almost a thousand kwh spread on a 4000watt aray from year to year. Very eye opening.
gww -
Re: Roofray solar calculator vs pvwatts
I had a chance to play with the affect of my tilt angle in the IMBY software. I was very surprised by the results. I used tilt angles of 0,10,20,30,40,50,and 60 degrees. for my location. My azimuth angle is 210 degrees. I used data from the years 1998,2000,2002, and 2004. I noted the month of each year with the highest output for a given tilt angle.
I tallied the results and ended with two ties for a total of 30 results. They were not at all what I thought they would be.
Jan. (0) Feb. (0) Mar. (2) Apr. (3) May (16) Jun. (3) Jly. (1) Aug. (3) Sep. (0) Oct. (2) Nov.(0) Dec. (0)
It would appear that May is a very good month for solar at my location. I can only guess that we have a lot more clear cool days in May than any other month.
I realize that my 21 degree roof on my carport may be better than I thought it would be. -
Re: Roofray solar calculator vs pvwattsSteppapajon wrote: »I tallied the results and ended with two ties for a total of 30 results. They were not at all what I thought they would be.
Jan. (0) Feb. (0) Mar. (2) Apr. (3) May (16) Jun. (3) Jly. (1) Aug. (3) Sep. (0) Oct. (2) Nov.(0) Dec. (0)
It would appear that May is a very good month for solar at my location. I can only guess that we have a lot more clear cool days in May than any other month.
I found March is the best month for my location. I guess this is because of clear sky and snow reflection. -
Re: Roofray solar calculator vs pvwattsI am currently monitoring three solar PV systems in Salida Colorado, and all are putting out significantly more (~20+%) than predicted by PVWatts as shown in Figs. 6 and 7 of link below. I have also included a literature survey of some other comparisons of PVWatts versus field measurements at:
http://www.residentialenergylaboratory.com/comparison_of_pv_systems.html
I've actually been looking more into this since our discussion in the mono VS poly thread.
It seems that the system derate is inaccurate. Since PV watts calculates for weather, avg cloud cover, soiling, hours of sunlight, angle of incidents, temp, the derate plug in number should be based only and specifically on conductor, and mechanical spec derates (mechanical conversion, voltage drop, etc, not level of light based on meter square.). If only based on mechanical derate, technically a string system at optimal mechanical efficiency should operate at 90%, a micro inverter system should operate at 91.5% optimal efficiency. Angle of incidents, hours of sun light are not derates as that is the optimal efficiency of the system based off angle of incidents to meter square. So while PV watts assumes 77% derate, PTC is much higher percentage based on conductor sizing and mechanical characteristics. -
Re: Roofray solar calculator vs pvwatts
For truly accurate derating you'd have to compare two identical systems; one located in Death Valley and the other in Baffin Bay. :roll:
You'd be amazed at how often that 'typical' 77% average derating is spot on.
There is absolutely no way to predict a system's output with 100% accuracy in advance. People who try to do so end up needing psychiatric care. -
Re: Roofray solar calculator vs pvwatts
77% has proved to be a bit conservative on my system and location, but only a couple % off. -
Re: Roofray solar calculator vs pvwattssolar_dave wrote: »77% has proved to be a bit conservative on my system and location, but only a couple % off.
Mine typically runs 82-84%, mainly because of the 3200' elevation.
No two systems are every identical, even at the same site, so the best you can expect from PV Watts and STC ratings is a relative guide. In that respect it is better to be conservative, because no one ever complains about having 'too much power available'. Lots of people complain about not having enough.


Categories
- All Categories
- 233 Forum & Website
- 140 Solar Forum News and Announcements
- 1.3K Solar News, Reviews, & Product Announcements
- 181 Solar Information links & sources, event announcements
- 896 Solar Product Reviews & Opinions
- 252 Solar Skeptics, Hype, & Scams Corner
- 22.5K Solar Electric Power, Wind Power & Balance of System
- 3.5K General Solar Power Topics
- 6.7K Solar Beginners Corner
- 1K PV Installers Forum - NEC, Wiring, Installation
- 2.1K Advanced Solar Electric Technical Forum
- 5.6K Off Grid Solar & Battery Systems
- 428 Caravan, Recreational Vehicle, and Marine Power Systems
- 1.1K Grid Tie and Grid Interactive Systems
- 656 Solar Water Pumping
- 816 Wind Power Generation
- 621 Energy Use & Conservation
- 623 Discussion Forums/Café
- 316 In the Weeds--Member's Choice
- 74 Construction
- 125 New Battery Technologies
- 108 Old Battery Tech Discussions
- 3.8K Solar News - Automatic Feed
- 3.8K Solar Energy News RSS Feed