Illustration of 8 KW (DC) GT Solar PV System Install for Residence in Urban Area
Comments
-
Re: Illustration of 8 KW (DC) GT Solar PV System Install for Residence in Urban Area
Did you put in the steel roof that gives the 30% tax break? S:Dlarvic
As a matter of fact I did go with the highest reflective color available which is Solar White. I will get a tax credit for the roof as well as the PV system. -
Re: Illustration of 8 KW (DC) GT Solar PV System Install for Residence in Urban Area
I wasn,t mean after all. Glad for you that you didn,t miss out on it. My neighbor put steel up after her 30 year certainteeds went bad in less than 15 years. There is a class action on thier shingles. Another friends didn,t last either. I hope my brand doesn,t die prematurly as I have a friend that had to replace hers about 6 years before warranty was expired. Solarvic -
Re: Illustration of 8 KW (DC) GT Solar PV System Install for Residence in Urban Area
Here in South Florida it's pretty much expected that 30 year shingle roofs will only go 20 years and that is only if you are lucky. The asphalt gets incredibly hot in the scorching sun and then we get thunderstorms that open up with 1"+ per hour cold rain almost every Summer afternoon. It kills the roof longevity in brutal fashion. I think metal is the way to go for long life and also for wind resistance in the Hurricane prone sub-tropics. -
Re: Illustration of 8 KW (DC) GT Solar PV System Install for Residence in Urban AreaThank you for your comments, newenergy.
What would you use to protect the EGC? If I were to put in some EMT, is EMT suitable from a rust avoidance perspective?
Missed this. You could use EMT and then there are ground clamps that clamp the rod on one end and fit the EMT on the other. Or, armored bx cable with a bare ground. It would have a fitting into the panel (disconnect or w/e). They would look like this, except I only found a picture of BX with a few conductors, this would just have a bare ground.

-
Re: Illustration of 8 KW (DC) GT Solar PV System Install for Residence in Urban Area
Is there any consensus/conclusion to the estimate of the loss due solely to having strings with different orientation on the same inverter?
(not different orientation within the same string) -
Re: Illustration of 8 KW (DC) GT Solar PV System Install for Residence in Urban Area... You could use EMT and then there are ground clamps that clamp the rod on one end and fit the EMT on the other. Or, armored bx cable with a bare ground. ...
Many thanks.
Best regards,
Bill -
Re: Illustration of 8 KW (DC) GT Solar PV System Install for Residence in Urban AreaIs there any consensus/conclusion to the estimate of the loss due solely to having strings with different orientation on the same inverter?
(not different orientation within the same string)
I'm not sure.
SG estimates my system (36 Astronergy 225 W panels (8.1 KW DC), 3 strings of 12 panels, one Sunny Boy SB7000 inverter) has a one-third harvest loss.
My system has 4 characteristics that bring down the harvest from what PVWatts at default (0.77) predicts:- Strings with different panel orientations on same inverter.
- Panels with different orientations within a string.
- Panels not at 180° azimuth (default orientation) (this one alone costs 8% harvest).
- Shading.

Best regards,
Bill -
Re: Illustration of 8 KW (DC) GT Solar PV System Install for Residence in Urban Area
I really look forward to watching your graph fill out. I feel like I have been waiting forever (oh wait, I have) to get my installation started. There is light at the end of the tunnel for me, maybe. The installer says that they plan to have my system completed by the 26th. Sure they will. LOL Anyway, I sure have enjoyed your thread and live vicariously through folks like you that actually have working systems. -
Re: Illustration of 8 KW (DC) GT Solar PV System Install for Residence in Urban AreaI ... look forward to watching your graph fill out. ...
I've watched the chart here since I first posted it, to confirm that it's updating in real time. Indeed it is.
This year will be a 10 month year, starting Mar. 1st. March is the first full month the solar PV system will run.
It's too early to accurately discern status numbers from the chart, so I looked up the actual YTD numbers.
Seventeen days into this 10 month year:- PVWatts estimate at 0.77 default (no shade, all panels at 180°, pitch at lattitude, etc.) for my Dallas location = 528 kWh (36 panels @ 225 watts each)
- 80% of 0.77 default PVWatts estimate (a common minimum expectation for utilities offering rebates) = 422 kWh
- Actual harvest = 401 kWh
Best regards,
Bill -
Re: Illustration of 8 KW (DC) GT Solar PV System Install for Residence in Urban Area
How are you determine your daily/weekly targets when PV watts breakdown in monthly?
I'm really surprised a GT system that that performs at only 62% of name plate is considered acceptable in your area. -
Re: Illustration of 8 KW (DC) GT Solar PV System Install for Residence in Urban AreaSolar Guppy wrote: »How are you determine your daily/weekly targets when PV watts breakdown in monthly?
I'm really surprised a GT system that that performs at only 62% of name plate is considered acceptable in your area.
From PVWatts Ver 2, using Cell ID 0218386, Lat 33.156, Long -96.557 (my location N of Dallas), assuming all panels are at Azimuth 180°, pitch is at Lat, and no shade (0.77 DC to AC Derate Factor):Harvest, Mar. - Dec. = 999 + 1034 + 1021 + 981 + 1033 + 1022 + 947 + 981 + 770 + 734 = 9522 kWh
Days, Mar. - Dec. = 31 + 30 + 31 + 30 + 31 + 31 + 30 + 31 + 30 + 30 + 31 = 306 days
Avg Harvest / Day (PVWatts 0.77 Default) = 9522 kWh / 306 days = 31.1 kWh/day (slope of PVWatts' line on my chart)
At this point I found an error with my chart. I had the slope based on March only (32.2 kWh/day), not the full 10 months of the year (31.1 kWh/day), as just written above.
I fixed the chart. And, restating what I wrote earlier this morning:Seventeen days (actually 16.5 days at the moment) into this 10 month year:- PVWatts estimate at 0.77 default (no shade, all panels at 180°, pitch at lattitude, etc.) for my Dallas location = 513 kWh (36 panels @ 225 watts each)
- 80% of 0.77 default PVWatts estimate (a common minimum expectation from utilities offering rebates) = 411 kWh
- Actual harvest = 407 kWh
Thanks for helping to catch this error. The chart is now based on the 10 month Mar. - Dec. PVWatts 0.77 Default total of 9522 kWh.
Looking at how the system is performing relative to Nameplate:
513 kWh / 0.77 = 666 kWh so far Nameplate production this 'year.'
407 kWh actual harvest so far this 'year' / 666 kWh = 61%
Yep, for the first 17 days into the 10 month 'year,' the system is performing at 61% of Nameplate, and at 80% of the PVWatts 0.77 default. This pereformance is at the edge of what the local utility company is expecting from installers who are turning in requests for rebates.
We'll see as time moves forward how the weather holds up.
Best regards,
Bill -
Re: Illustration of 8 KW (DC) GT Solar PV System Install for Residence in Urban Area
Actually, the issue I see is your using a yearly average to calculate the daily % of PV watts, the concern is this ramps up and down with the seasons , To be accurate your slope should change every month as the temperature, sun hours and rain all vary with the seasons.
With a constant monthly target, the months your array should be making more will easily "meet" your targets and the month ( like dec ) will be vastly behind the target ( less sun hours )
If your only looking for annual percentages, as is will be fine, but you won't know until the full year how bad it is ... the finer the resolution ( you can do monthly ) you should know within 2-3 months where your actual performance to goal really is.
If you spend a few hours with Excel, you could further define true daily or weekly targets using slope functions. -
Re: Illustration of 8 KW (DC) GT Solar PV System Install for Residence in Urban AreaSolar Guppy wrote: »... you're using a yearly average to calculate the daily % of PV watts, the concern is this ramps up and down with the seasons , To be accurate your slope should change every month as the temperature, sun hours and rain all vary with the seasons.
With a constant monthly target, the months your array should be making more will easily "meet" your targets and the month ( like dec ) will be vastly behind the target ( less sun hours )
If your only looking for annual percentages, as is will be fine, but you won't know until the full year how bad it is ... the finer the resolution ( you can do monthly ) you should know within 2-3 months where your actual performance to goal really is.
If you spend a few hours with Excel, you could further define true daily or weekly targets using slope functions.
Agree completely, SG.
In fact, I first started out looking at harvest vs. PVWatts estimate on a day by day basis. I quickly decided that wasn't very useful as the finest resolution data from PVWatts is by month.
Then I moved to looking at harvest vs PVWatts estimate on a month by month basis. As you note, slopes would change monthly based on season. I decided this wasn't useful only because it required me to do some work every month adjusting the chart(s).
So I moved to looking at harvest vs PVWatts estimate on an annual basis. Actually what I'll do is look at it on a rolling 12 month basis. Over 12 months, this will do a good job of 'washing out' the variations in weather, and resulting in a pretty accurate measure of performance versus capacity.
Like you suggest, I've got some offline Excel charts.
Summary at the moment, 17 days into the 'year,' is harvest is at 61% of 'nameplate,' and is right at 80% of a 0.77 default PVWatts estimate. Agreed this is heavily weather dependent.
Much appreciate the comments.
Best regards,
Bill -
Re: Illustration of 8 KW (DC) GT Solar PV System Install for Residence in Urban AreaThe original electrical panel install is clean. I note the use of a spare scrap of wire to tie a bundle of wire (upper right) - this is an old trick from before zip ties became common. There are two methods; A) spiral wound as in this example, and
") wrap once around and then twist/cut with lineman's pliers much like a twisted connection before wirenutting...except cut much shorter to only have one or two twists - and of course you don't strip the ends of the tie wire. Either way is good (personally I use method B because I think it's stronger) and both usually indicate some "Old Schooler" did the work. I still prefer this method over zip ties in a panel - it's often easier to install than zip ties, and it's a LOT easier to remove if you need to.
wrap once around and then twist/cut with lineman's pliers much like a twisted connection before wirenutting...except cut much shorter to only have one or two twists - and of course you don't strip the ends of the tie wire. Either way is good (personally I use method B because I think it's stronger) and both usually indicate some "Old Schooler" did the work. I still prefer this method over zip ties in a panel - it's often easier to install than zip ties, and it's a LOT easier to remove if you need to.
There's been some discussion about zip ties vs. stainless steel straps and other things for securing the PV cable on the roof. What about doing it like this? Carrying some 10" pieces of #12 or #14 solid copper wire and making a strap like that? -
Re: Illustration of 8 KW (DC) GT Solar PV System Install for Residence in Urban Area
i don't think that will get approved as the insulation would need to be rated for out in the sun and weather. regular wire will shed its insulation in time from the sun and weather eventually bringing it down to just the copper wire itself which will corrode and eventually decay too. -
Re: Illustration of 8 KW (DC) GT Solar PV System Install for Residence in Urban Areai don't think that will get approved as the insulation would need to be rated for out in the sun and weather. regular wire will shed its insulation in time from the sun and weather eventually bringing it down to just the copper wire itself which will corrode and eventually decay too.
But bare copper is what we're using for equipment ground. How long is it going to work?
You must have some tough inspectors where you are. I wouldn't be a bit worried about getting it approved. I'm just thinking about whether it's good or not. -
Re: Illustration of 8 KW (DC) GT Solar PV System Install for Residence in Urban Area
i'm just bringing up a possible kicking points. a copper wire strap holding a copper ground wire is fine so far. now wrap that around a dissimilar metal and you get trouble.
btw the strap wire will most likely not be as thick as a ground wire and corrosion will kill that copper wire strap first.
i actually don't know if the nec would disapprove, but my guess is that they would disapprove of it. -
Re: Illustration of 8 KW (DC) GT Solar PV System Install for Residence in Urban Area
There's discussion going on at another thread in the Grid Tie forum, about MPPT performance.
The discussion is very interesting with respect to how MPPT works (or doesn't work in some cases with a certain model of Fronius inverter).
I thought I'd take a look at a similar MPPT analysis for my Sunny Boy SB7000US inverter, since I have a challenging panel layout with respect to multiple orientations and shading. Today's a nice bright sunny day so it should produce good numbers.
Here's a chart with the data direct from my inverter. Sample frequency is once every 30 seconds (the Sunny Data Control s/w doesn't allow for any faster sampling frequency).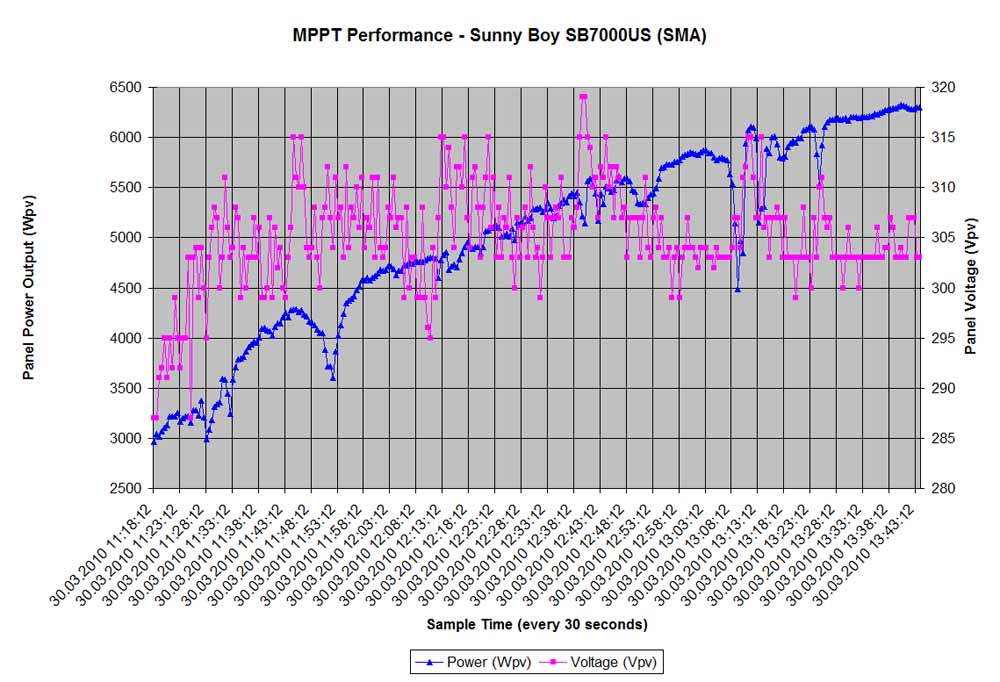
(36 panels @ 225 W each, 8.1 KW Nameplate, 3 strings at 12 panels each, 27 panels at 210° (azimuth) - 9 at 285°, some shading throughout the day at various places)
I don't know a lot about what is good versus not so good MPPT performance. Just by looking at the voltage swings being in the 10+ VDC range my guess is my SB inverter's MPPT function is working pretty well.
Best regards,
Bill -
Re: Illustration of 8 KW (DC) GT Solar PV System Install for Residence in Urban Area
Learned a lot during this first full month of production.
First, climatic conditions substantially affect the output. Here's an image showing (amongst other things) how cloud edge momentarily increases PV output: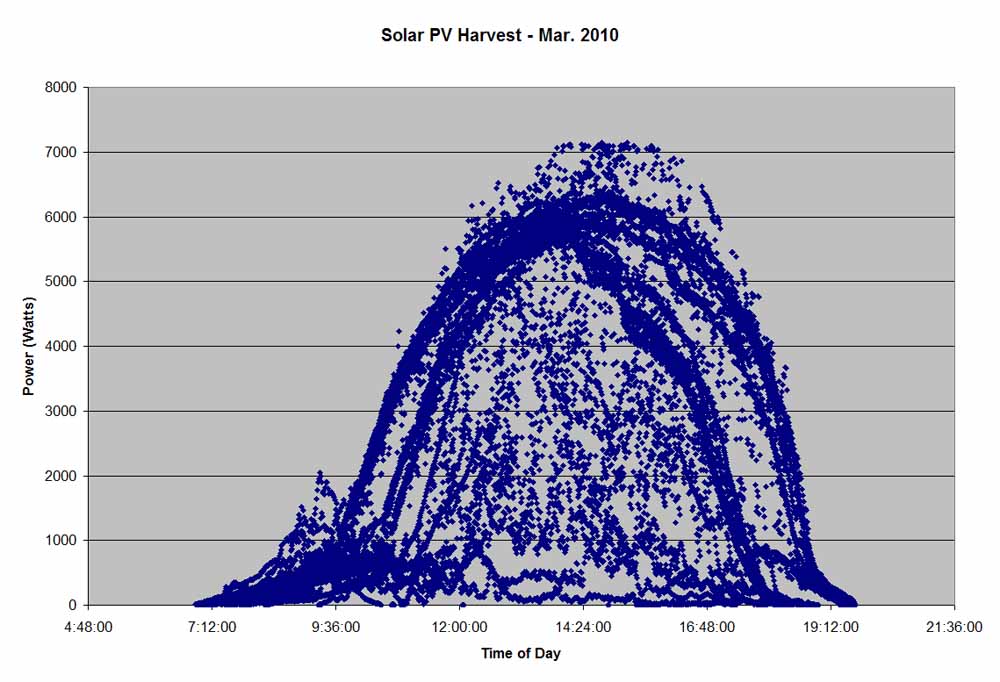
On a cloudless day, PV power output doesn't get much above 6.2 KW. But on a partly cloudy day, it gets upwards of 7.1 KW (my inverter's an SB 7000). (It also looks like a partly cloudy day occasionally triggers the inverter's MPPT function to a higher performing point.)
With many kinds of days in March, it's now obvious how much weather affects output, and not just temperature or clouds. Humidity (low is better) and wind (high is better) were clearly observable to make a difference. Throw in day of the year (distance to the sun and insolation), and my conclusion is that it's difficult to precisely assess the performance of a PV system's kWh harvest. I.e., no sense getting carried away with extensive instrumentation.
That said, here's some summary numbers for the month (March):PVWatts Ver 2 Insolation estimate = 5.49 kWh/m2/day (accounts for historical weather pattern)The conclusion here, for March, that had a lot of sunny days, it that my PV system doesn't meet a PVWatts' 0.77 Default estimate (due to my implementation of multiple panel orientations, and shade, all with just one inverter), but it did perform within the utility company's expectation for rebated systems.
Nameplate PV system performance = 1379 kWh (ideal performance before derating for equipment, wiring and design performance, and panel temperature; panels assumed at 180° azimuth and default Long. pitch; no shade)
PVWatts Ver 2 Harvest estimate at 0.77 Default = 999 kWh (this is actually 72% of nameplate because PVWatts factors in panel temperature; panels assumed at 180° azimuth and defult Long. pitch, no shade)
Actual Harvest = 881 kWh (64% of Nameplate; 88% of PVWatts' 0.77 Default estimate)
Utility company's minimum performance expectation for a rebated system = 799 kWh (58% of Nameplate, 80% of PV Watt's 0.77 Default estimate)
Thinking further about SG's earlier suggestion for looking at performance on a monthly basis, I indeed changed my chart. It now resets to zero at the beginning of each month, and will have different reference line slopes as a function of month. Below you can see March's 881 kWh harvest, and how it positioned relative to PVWatts' 0.77 Default and the utility company's 80% expectation.
I learn a lot here every day, and I again say many thanks to everyone's contributions of knowledge.
Best regards,
Bill -
Re: Illustration of 8 KW (DC) GT Solar PV System Install for Residence in Urban Area
Nice charts. In your PV harvest chart, did you adjust for the daylight savings change? It doesn't look like it to me... -
Re: Illustration of 8 KW (DC) GT Solar PV System Install for Residence in Urban Area... In your PV harvest chart, did you adjust for the daylight savings change?
No. And thus you can see the 1 hour shift in the first chart above.
Best regards,
Bill -
Re: Illustration of 8 KW (DC) GT Solar PV System Install for Residence in Urban Area
Great data!
If it makes you feel better I have about 1800w up on the roof, 180 south, 45* tilt, no shading issues and in March I got 241.3 kwh out on the DC side. PV watts had me at 190 on the AC side, but I do have 15 watts 24x7 running on the DC side. It wasn't a bad month, but we are up at 44.5* north and 88* west. As you have found cooler dryer days with a bit of wind help out a lot.
I gather my data by simply loggin my daily solar output (the unit holds the last 60 days) and drop them in a spreadsheet.3kw solar PV, 4 LiFePO4 100a, xw 6048, Honda eu2000i, iota DLS-54-13, Tesla 3, Leaf, Volt, 4 ton horizontal geothermal, grid tied - Green Bay, WI -
Re: Illustration of 8 KW (DC) GT Solar PV System Install for Residence in Urban Area... As you have found cooler dryer days with a bit of wind help out a lot....
I actually had no appreciation for how much humidity affects actual harvest, until looking at performance this month. I thought going in that a perfectly cloudless day would be a good indicator on performance.
We had many cloudless days in March, and thus had opportunity to look carefully at performance. I was surprised to see the variability of performance for the cloudless days. Once I started paying attention to RH, it was easy to see a relationship between harvest and humidity, for days that are otherwise the same (i.e., cloudless, same temperature, nearby in the calendar, etc.).
Best regards,
Bill -
Re: Illustration of 8 KW (DC) GT Solar PV System Install for Residence in Urban AreaI'll use this weekend to get caught up to date. Considerable progress overall.
The first City inspection went fine, with the only requirement noted before a re-inspection was labelling needed to be increased. A warning sticker to not move the PV back-feed circuit breaker was added to the outside of the service panel. A sticker was also placed on the outside of the inverter, with its various DC and AC capacities and limits noted.
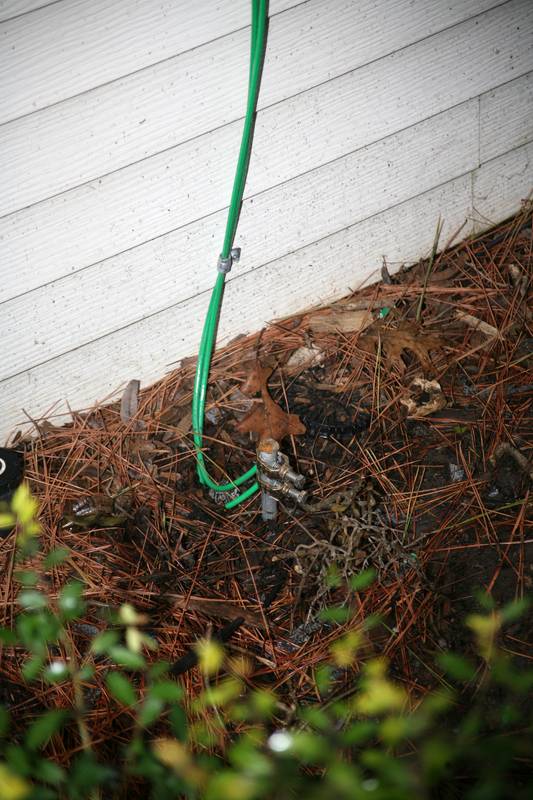
We got surprised by the second City inspection, thinking that all that would be re-inspected were the newly placed labels. Instead, the City asked for additional grounding connections, and asked for re-inspection again.
What was asked for was 3 things:- A new grounding rod.
- A new unspliced #6 insulated ground wire from the new grounding rod to the inverter's AC Ground terminal.
- Another unspliced #6 insulated ground wire from the same grounding rod to a panel rail.
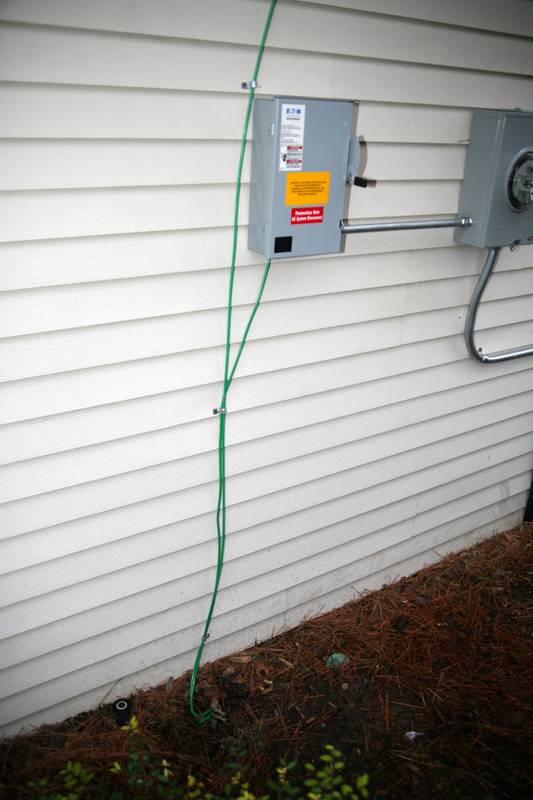
The inverter's AC ground terminal is in the upper right corner of the last image.
Grounding theory for on-the-roof solar PV systems is not something I understand. Thus, I'm not able to explain what purpose this additional grounding serves.
Best regards,
Bill
Sorry, haven't been around much and I'm playing catch-up. I have to say, this was looking pretty good until those extra ground wires were added...but those look horrible.
First of all, they just weren't installed very cleanly. The way they are run is very sloppy looking - and running that one through a drilled hole (not even de-burred!) is just bad. At the very least it should have been secured with a 30 cent clamp connector:
http://www.google.com/products/catalog?q=romex+cable+clamp&oe=utf-8&rls=org.mozilla:en-US:official&client=firefox-a&um=1&ie=UTF-8&cid=10694536578273117828&ei=OvjAS_v8NcHOngeEsrW4Cg&sa=X&oi=product_catalog_result&ct=result&resnum=3&ved=0CB0Q8wIwAg#ps-sellers
I don't understand the requirement for the grounding conductors to be insulated - normally they would be armored. I don't trust that insulation to last long and I don't like it being below grade either. I would have questioned the use of insulated conductors and would have asked permission to use armored instead. If I then still had to run insulated, I would have run them in EMT - as they are now they are just BEGGING for a gardening accident to rip them loose.
I don't like the ground clamps on the rod. I don't *oppose* those clamps for use with *solid* conductors, but I would never use them with stranded. In any case, I normally use this type with armored cable (they work well for stranded too):
http://www.yourelectricalsource.com/media/subcategories/9l.jpg
If I had been required to use insulated and then ran it in EMT, I would have used this type:
http://www.galvanelectrical.com/images/pipe_ground_clamp_conduit_swivel.gif
(It's worth noting that both types are designed to clamp around a pipe like this <O> - but the lower jaw can be flipped over to clamp a ground rod like this <o<. Not all of these type clamps have the feature to flip the lower jaw. You can tell the difference by examining the lower jaw...if it has "teeth" on both sides, then it's designed to be flipped.) -
Re: Illustration of 8 KW (DC) GT Solar PV System Install for Residence in Urban Area
dhw, I appreciate the comments. I have learned a lot from you and all contributors here. And I know that in the future those researching before they put in a solar PV system, and who read this thread, will additionally and substantially benefit.
Many thanks!
Best regards,
Bill -
Re: Illustration of 8 KW (DC) GT Solar PV System Install for Residence in Urban Area
I have questions about a change happening to my string layout, My contractor is coming back this month to add another 12 panels to my system We currently have 6 strings of 10 going 2 PVP5200 inverters. they will change this to 8 strings of 9 on the panel add.
is this going to work OK. -
Re: Illustration of 8 KW (DC) GT Solar PV System Install for Residence in Urban Area
You didn,t give your location but coldest temp of 30f you must be just about in The ocean. If you are that far south than I don,t think that your 110f is hot enough. At 110f your inverter is below the operating voltage with strings of 9 and at 30f you are at 499 v with strings of 10.With an inverter with a limit of 500 v. Don,t look like a very good inverter choice for the kind of panels you are using. 4 strings of 9 overload the ac watts. too low vmp@ warmest day. I think 30 panels is too much if you go below 30f. I just did an estimate for my location and The string chart says that below 28 f it is not usable. If your installer put them up I would try to get him to take them back and get something more usuable with those panels you have. 4 strings of 9 won,t work. S:Dlarvic -
Re: Illustration of 8 KW (DC) GT Solar PV System Install for Residence in Urban Area
It says Phoenix in the PVWatts page.
The PVPowered string sizer doesn't like strings of 9. It predicts 25.6V x 9 = 230V on the warmest days, which is below the DC voltage operating range.
(from what I can figure it looks like their sizer is allowing for much hotter cell temperatures than ambient temp)
So, above 105f or something like that your inverters may not work properly. That would be fine where I am, but in Phoenix it sounds like an average summer day. -
Re: Illustration of 8 KW (DC) GT Solar PV System Install for Residence in Urban Area
Yes I guess it probably won,t get below 30f in phoenix. I still think the inverter isn,t a good match for those panels. He is locked in 3 strings of 10 and hope temp never goes below 28F. The way the weather was this winter anything is possible. If he wants more panels he will need to add another inverter and I would try to get a better match with whatever panels he was going to use.S:DlarvicIt says Phoenix in the PVWatts page.
The PVPowered string sizer doesn't like strings of 9. It predicts 25.6V x 9 = 230V on the warmest days, which is below the DC voltage operating range.
(from what I can figure it looks like their sizer is allowing for much hotter cell temperatures than ambient temp)
So, above 105f or something like that your inverters may not work properly. That would be fine where I am, but in Phoenix it sounds like an average summer day. -
Re: Illustration of 8 KW (DC) GT Solar PV System Install for Residence in Urban Area
My system has been in operation for about 5 months now. I'm going to post some charts and comments on how it's performing.
First of all, a summary of design:- 36 panels (Astronergy 225 W), 3 strings of 12 panels, multiple panel orientations (azimuths) per string (185° and 225°), multiple string orientations connected to the inverter (185° and 225°), some shading during different parts of the day from trees and chimney.
- 8.1 KW (DC) total panel capacity connected to one cental grid-tied 7000 W inverter (SMA SB7000).
- PVWatts estimates 5.5 daily sun hours for my location and weather pattern - Dallas, 75074, 33° N Latitude.

The peak power produced is averaged over one hour increments to eliminate noise generated by passing clouds.
Observations include:- Max power ranges from about 5250 to about 6500 Watts. So far appears to be well within the inverter's max 7000 W input limit.
- Max power appears to be influenced by outside temperature and amount of moisture in the air. It appears to fall with higher temperatures and more water in the air. Days with the highest power output were in April where many of the days had simultaneously lower temperatures and lower humidities.
Best regards,
Bill


Categories
- All Categories
- 229 Forum & Website
- 136 Solar Forum News and Announcements
- 1.3K Solar News, Reviews, & Product Announcements
- 179 Solar Information links & sources, event announcements
- 892 Solar Product Reviews & Opinions
- 252 Solar Skeptics, Hype, & Scams Corner
- 22.5K Solar Electric Power, Wind Power & Balance of System
- 3.5K General Solar Power Topics
- 6.7K Solar Beginners Corner
- 1K PV Installers Forum - NEC, Wiring, Installation
- 2.1K Advanced Solar Electric Technical Forum
- 5.6K Off Grid Solar & Battery Systems
- 428 Caravan, Recreational Vehicle, and Marine Power Systems
- 1.1K Grid Tie and Grid Interactive Systems
- 655 Solar Water Pumping
- 816 Wind Power Generation
- 620 Energy Use & Conservation
- 622 Discussion Forums/Café
- 316 In the Weeds--Member's Choice
- 74 Construction
- 125 New Battery Technologies
- 107 Old Battery Tech Discussions
- 3.8K Solar News - Automatic Feed
- 3.8K Solar Energy News RSS Feed